Do you ever wonder why you see so many ads on Facebook, Instagram, and YouTube? Whatever you see on a shopping site or even any of the websites, the next moment you see an ad influencing you to make a purchase of that product or services.

Think of Netflix or Hotstar, we often see a suggestion “You may also like”. How do they know what you may like and why you may like that suggestion to watch as your next option. This is exactly what data analysis does. They understand your past preference, likings and your interest and accordingly suggest/ influence your future decision making.

Why Ola & Uber prompts an offer on airport cabs. How is the sales volume increased by providing this huge level of discount? Well, there is a calculation behind it, there goes an analysis in the back end, which is a classic example of Data Analysis.

Basically, Data Analysis is a process where one gathers data rom the sources available and then verifies it, researches, transforms the same and make a conclusion out of it with the help of graphs and charts which helps in decision making.

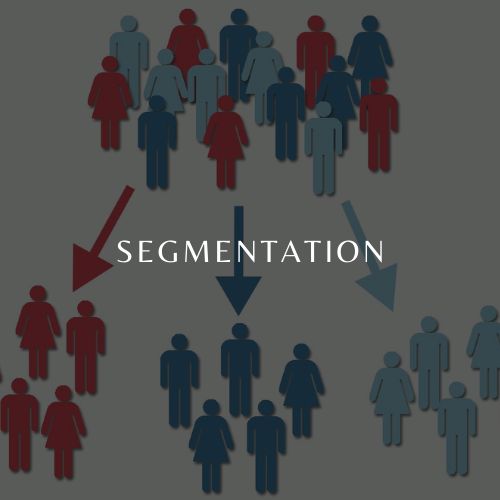
Since the world is moving towards digitization in almost everything, Data Analytics is playing a very important part in digital marketing. Analysis of the digital marketing platforms helps to influence the customer to take action. Using digital data analytics, marketers can understand the buying patterns of the consumers and also the demographics through multiple online channels.

Nowadays, most marketers use social media for marketing their brands. How they use social media and digital platform is all the data analysis that goes behind it. Let’s learn a little bit more about how data analytics can be useful in current scenarios. However before that, lets understand what questions we need to keep in mind: 

1, Where to source data from? 

2. How data can be analyzed?

3. What data  to use?

4. What kind of data may be required?


Answers to the above questions can help us with the necessary data that we might need. Data Analysis in this era can be useful in multiple ways and can help gain a huge market and consumers. Let’s learn a few of the benefits of data analytics in the world of digitalization.


  1. Help understand the choice of the consumer/users.

Data is playing a crucial part in almost all the businesses. Not only it helps to generate sales but also to understand the preferences of consumers or the end-users. With the help of Data Analytics, one can have clarity over the vision and its achievements. In the era of Digitalization, Data Analytics is more than important as it can drive positive growth.

Consumer choice
Helps understand consumer choice
  1. Segmentation 

Data Analytics also helps segment the target audience on the basis of multiple factors such as age group, nationality, country, preferences, color, choice, etc. This can help one to customize the product or services as per the need of the end-user. Once you segment the audience into a group of similarities, it will be far more easier to target that set of Audiences.

Eg: say, your Product is kids bicycle, however, kids may not be present on the digital platform who is your actual target audience, so now you can analyze the data of parents with the kids of the said age and target them.

Segmentation
Helps to Segment the Target Audience
  1. Increased Operational Efficiency

Data Analysis not only helps the consumers get the best of products/services but also helps the organizations to increase their efficiency. The overall work can be efficiently managed if one has the idea of how and where the team is putting efforts and how much time is going into one activity. Detailed Data Analysis of Employees’ work time distribution can help improve productivity. Apart from that, Understanding Machine time and Production setup by analyzing its data in Manufacturing set up can help in Overall Operational efficiency.  

Operational Efficiency
Increases Operational Efficiency
  1. Cost and Efforts Reductions

The availability of data, transferring it to Visual, and Creating a set not only helps to set a Target Audience but at the same time reduces the cost and efforts to generate Revenue. How it helps reduce cost is a simple understanding, When the problem area is under control, time, and efforts required reduces in turn increases productivity. This reduces cost and increases revenues and profit.


Cost and Efforts Reduction
  1. Improved Logistic and Supply Chain Management.

When you know the exact audience, the Supply chain reduces and in turn improves the Logistics as well. Data Analytics helps to spot patterns and trends which can aid in predicting future risk. Also, Data analytics can help to validate data, Improve demand forecast, and also Inventory management.

SCM
Improves Logistic and Supply Chain Management
 

There are ample ways to do data analytics of which some of the methods have gained immense popularity. Let’s check out some of these methods.

1. Data Visualization

According to the marketing industry influencer Krista Neher, the human brain can process images up to 60,000 times faster than words. They say that you don’t get a second chance to make a first impression. The human brain registers visuals much faster compared to normal text data. Hence, many businesses are now using data visualization tools to graphically represent the set of data available.

Fernanda Viegas and Martin M. Wattenberg suggested that an ideal visualization should not only communicate clearly but stimulate viewer engagement and attention.

2. Power BI

One of the Data Analytic Tools by Microsoft provides interactive visualization and Business Intelligence. Power BI can help with understanding Data, Transform it into charts or graphs to provide visualization of Data. Power BI can handle a large amount of Data. Its Dashboards are more Interactive as compared to normal Excel.

3. Tableau

Tableau is very powerful and growing quickly for data visualization. Dashboard and worksheets creations are part of Tableau’s data visualization. It helps to Analyse data on a real-time basis and also helps with the merging of data. Scripting is not needed for securing data on Tableau. Also, one does not require any knowledge of coding/

4. Data Analytics Excel. 

Excel for data analytics is most suitable for statistical data. Excel gives multiple functions like sorting the data, filtering the data, using multiple formulae to analyze the data and present the same. Manual creation of charts, graphs is possible using the data on the excel that is provided. Excel also provides the feature of Pivot tables.

6. R programming.

R programming is a programming Language for data manipulations, calculations, and graphical displays. R is designed as a computer language. R programming is easy to use and formulae and mathematical symbols can be easily understood.

Hence, Data Analytics is taking over the world by storm, and that it will become the next big thing in the upcoming years. In fact, most fortune companies have understood the importance of data analytics in the Digital world and are hiring professionals to help them decode the data and give them the much-needed analysis to pierce the market and create a niche accordingly. Also, These professionals are paid a handsome amount for the job


Many Courses are available for Digital Marketing. However, now the world is moving towards Data Science and Data Analytics and the current world demands not only knowledge of digital marketing but also Data Analytics. Combination of Digital Marketing with Data Analytics is now going to be a boom and professionals with the knowledge of both skills will be in much demand by employees for the next 10 to 15 years at least.